MMX > Temperature Correction
It is abundantly clear that when Michelson's interferometer was turned 360 degrees it no longer read the same at point number 1 that it did at the start of rotation; What is unclear is why Michelson did not eliminate the error in his paper. Perhaps it was for the purpose of providing the least altered data upon the assumption that the audience would know to take the error into account themselves. Regardless, the error remains and misrepresents the experiment to a great extent.
Dayton Miller not only was involved in the original experiments to some small extent but also went on to do more similar experiments with Morely and then with his own team of professionals. While the 1887 MMX was only 36 total turns over a 3 day period, Miller created at least 4 different versions of the Michelson interferometer but tested them at multiple locations under vastly differing circumstances. From stagnant basements to the heights of the Mt Wilson Observatory. With 30+ years of experience with Interferometers and literally tens of thousands of readings, Miller's expertise in the subject matter is unquestionable. During his experiments he found that any interferometer is subject to temperature drift of the fringe set up. This could happen somewhat during a single rotation of the device but it is small and slow and only changes direction of drift over a very long period of time far far beyond a single rotation time of an interferometer.
Miller used a very intuitive method of correcting for this temperature drift by simply finding the difference between the beginning reading of a location and its reading after one rotation because it should not change at all of course. To bring the readings more in line with ideal circumstances devoid of drift, all that is necessary is to divide the difference among the reading points and apply a linear adjustment to undo the linear drift. Below is a table with the calculations for the MMX. It is unfortunate that each of the days represented in the paper are averages of 6 readings which did not have the temperature effect removed before averaging. If this had been done, it is likely a clearer picture would have arisen in the original paper.
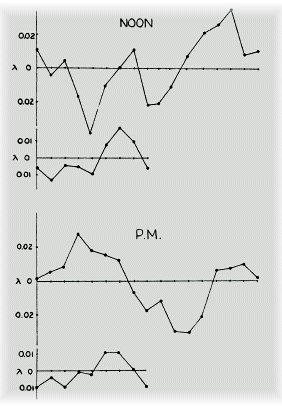
Please excuse any errors, while I believe it's all correct this was a lot of hand work done by myself over a few sessions and absolute perfection is unnecessary for me to demonstrate the principle I'm showing. Once graphed out you can see that these are the exact temperature corrections used by Miller in his graph of the Michelson-Morely results.
Note
16
1
2
3
4
5
6
7
8
9
10
11
12
13
14
15
16
Note
July 8 Noon
44.7
44.0
43.5
39.7
35.2
34.7
34.3
32.5
28.2
26.2
23.8
23.2
20.3
18.7
17.5
16.8
13.7
Offset:31
45.94
47.38
45.51
42.95
44.39
45.93
46.06
43.70
43.64
43.18
44.51
43.55
43.89
44.63
45.86
44.70
1.9375 per
July 9 Noon
57.4
57.3
58.2
59.2
58.7
60.2
60.8
62.0
62.5
63.3
65.8
67.3
69.7
70.7
73.0
70.2
72.2
Offset:14.8
56.38
56.35
56.43
55.00
55.58
22.25
55.53
54.10
54.98
56.55
57.13
58.60
58.68
60.05
56.33
57.40
.925 per
July 11 Noon
27.3
23.5
22.0
19.3
19.2
19.3
18.7
18.8
16.2
14.3
13.3
12.8
13.3
12.3
10.2
7.3
6.5
Offset 20.8
24.8
24.6
23.2
24.4
25.8
26.5
27.9
26.6
26.0
26.3
27.1
28.9
29.2
28.4
26.8
27.3
1.3 per
1
2
3
4
5
6
7
8
9
10
11
12
13
14
15
16
Mean
42.37
42.78
41.71
40.78
41.92
42.56
43.16
41.47
41.54
42.01
42.91
43.68
43.92
44.36
43.0
43.13
Final
41.96
42.4
42.31
42.23
42.92
43.46
43.08
42.3
41.96
16
1
2
3
4
5
6
7
8
9
10
11
12
13
14
15
16
July 8 6PM
61.2
63.3
63.3
68.3
67.7
69.3
70.3
69.8
69.0
71.3
71.3
70.5
71.2
71.2
70.5
72.5
75.7
Offset 14.5
62.39
61.49
65.48
64.08
64.77
64.86
63.46
61.75
63.14
62.24
60.53
60.33
59.42
57.81
58.91
61.20
.90625
July 9 6PM
26.0
26.0
28.2
29.2
31.5
32.0
31.3
31.7
33.0
35.8
36.5
37.3
38.8
41.0
42.7
43.7
44.0
24.88
25.95
25.83
27.00
26.38
24.55
23.83
24.00
25.68
25.25
24.93
25.30
26.38
26.95
26.83
26.00
1.125
July 12 6PM
66.8
66.5
66.0
64.3
62.2
61.0
61.3
59.7
58.2
55.7
53.7
54.7
55.0
58.2
58.5
57.0
56.0
67.18
67.35
66.33
64.90
64.38
65.35
64.43
63.60
61.78
60.45
62.13
63.10
66.98
67.95
67.13
66.80
.675
1
2
3
4
5
6
7
8
9
10
11
12
13
14
15
16
Mean
51.48
51.60
52.55
51.99
51.84
51.59
50.57
49.78
50.20
49.31
49.20
49.58
50.93
50.90
50.96
51.33
Final
50.84
50.46
50.88
50.79
51.39
51.25
50.77
50.56
50.84
